E-commerce Dashboard
Sales data you can read at a glance
brief.json
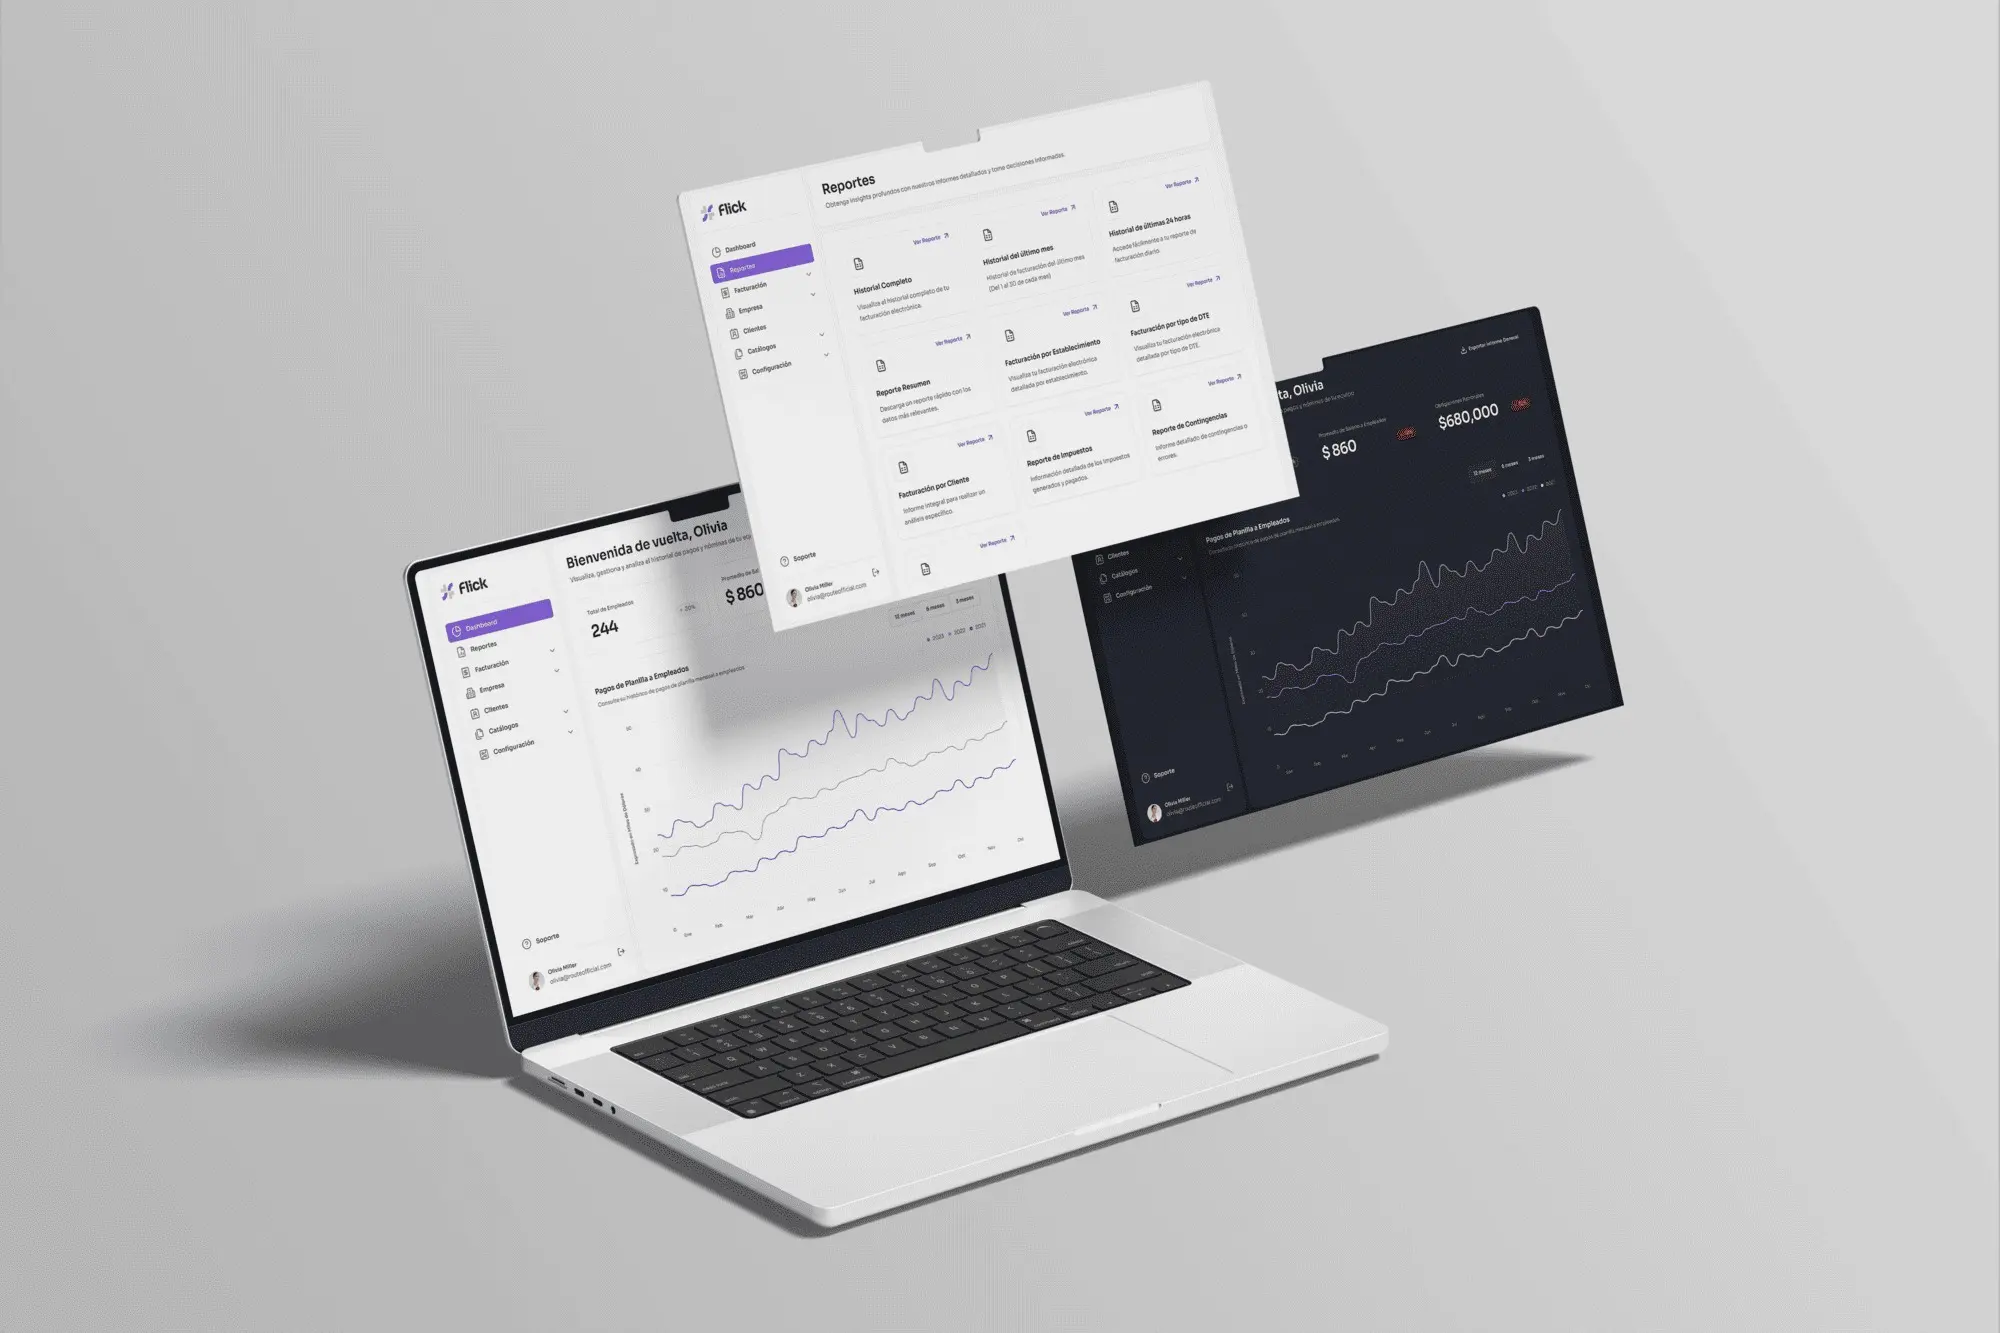
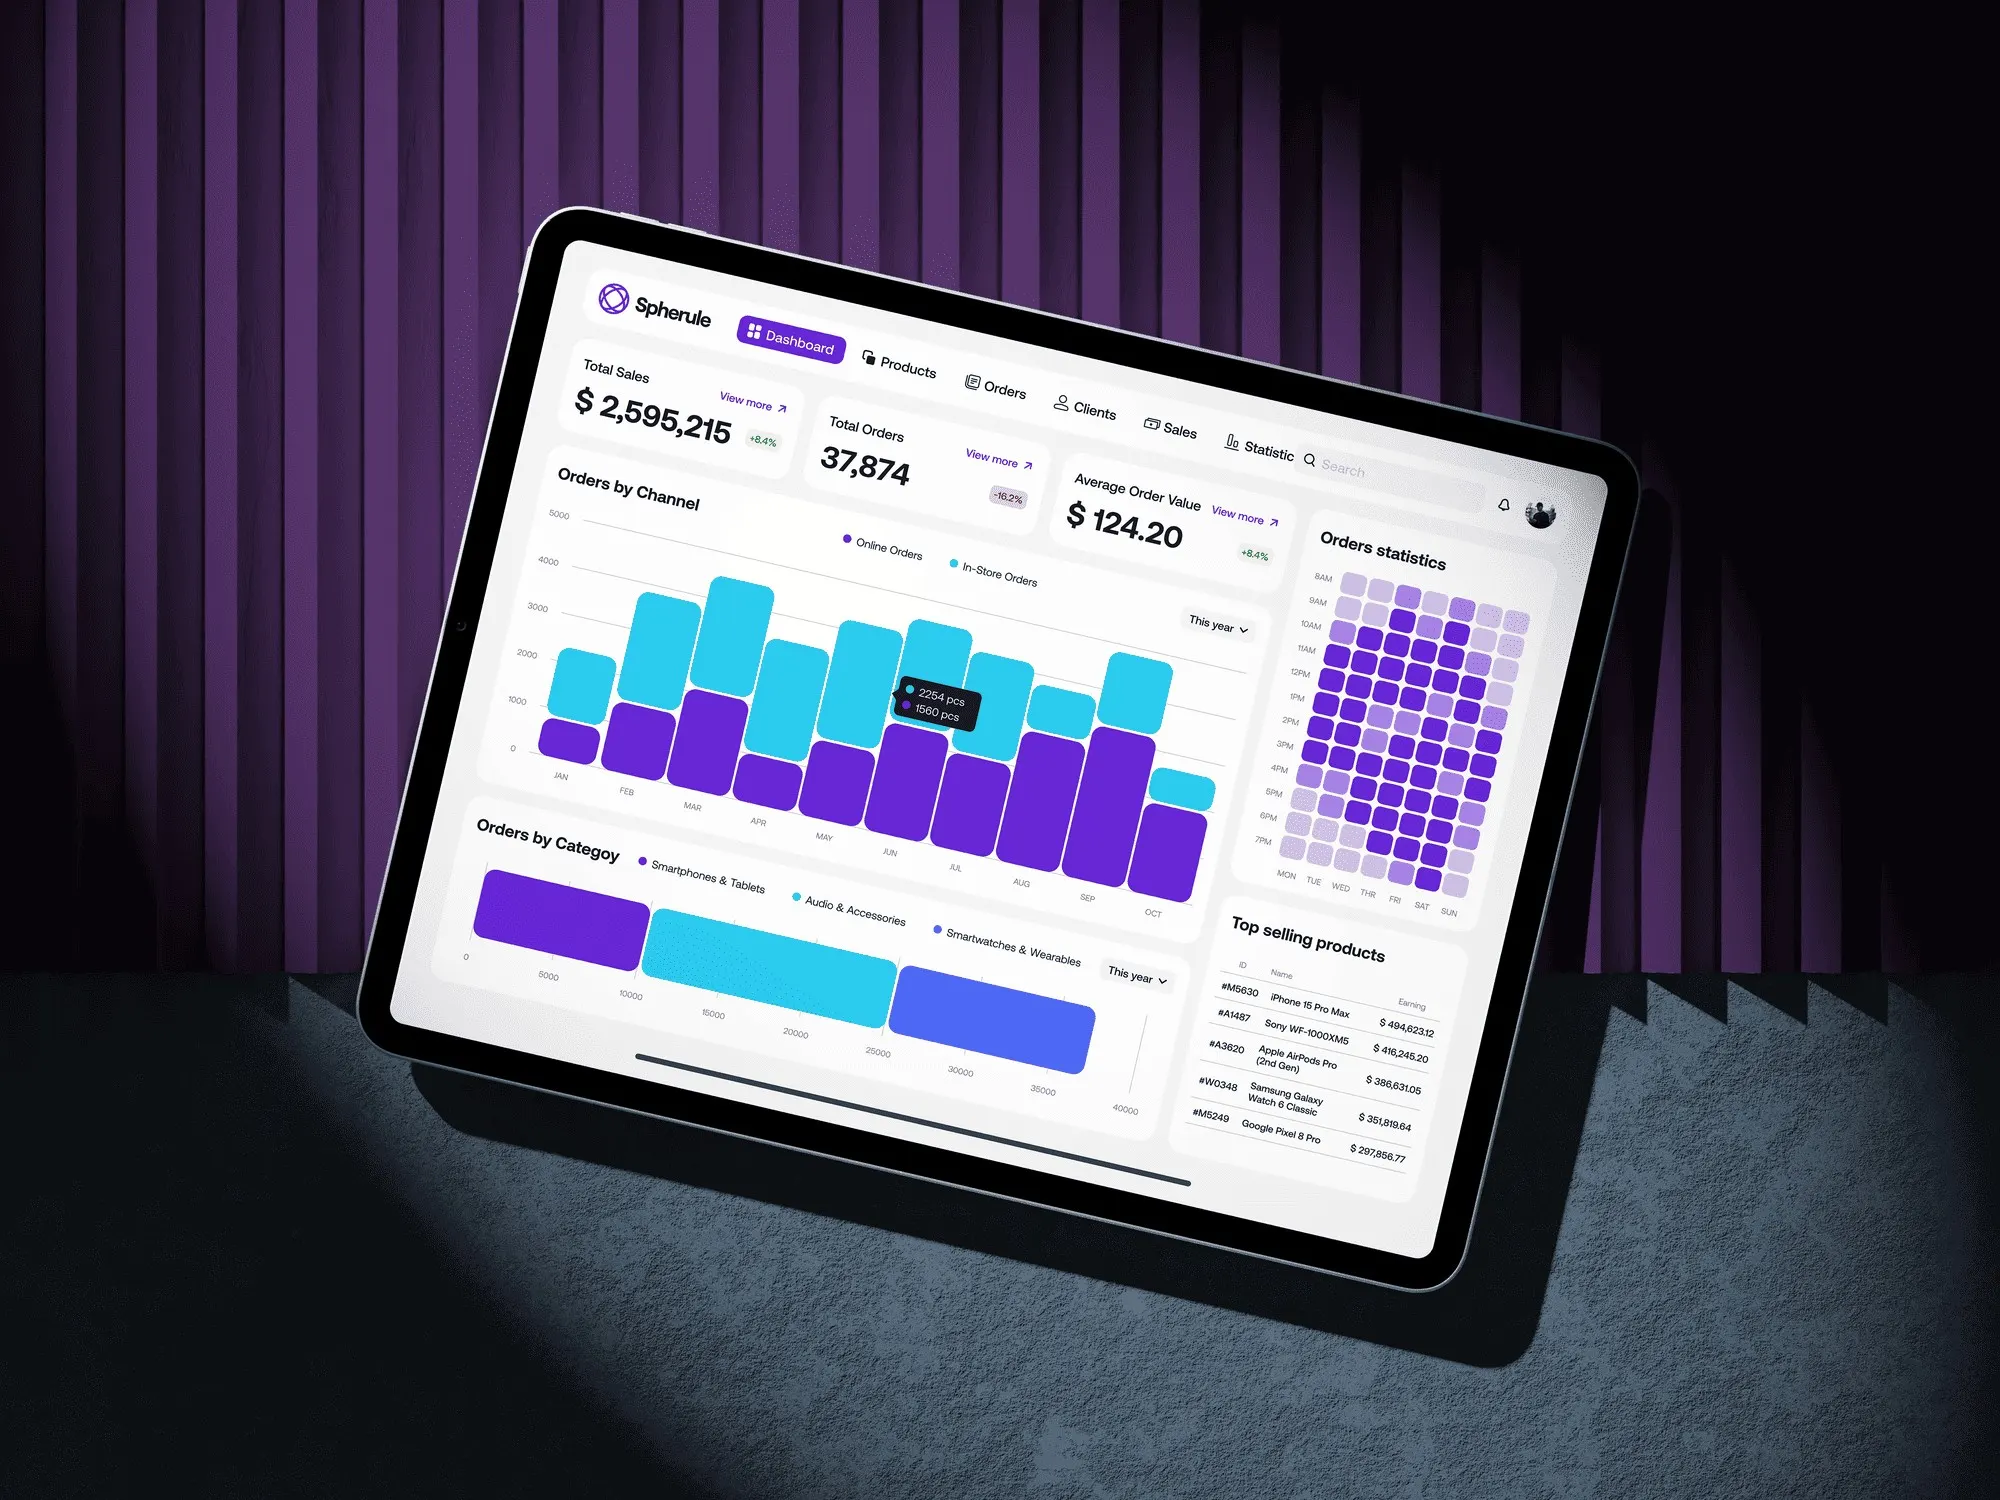
An e-commerce analytics dashboard. I ordered the sales data from general to specific. That way, the health of the business reads at a glance and the team can act fast.
- Year
- 2025
- Client
- Confidential
- Industry
- E-commerce
- Duration
- 3 weeks
- Type
- SaaS dashboard
SaaS designData visualization
Shown for portfolio purposes only. Brands belong to their owners; if you own it and want it removed, email me. Terms ↗
01Challenge
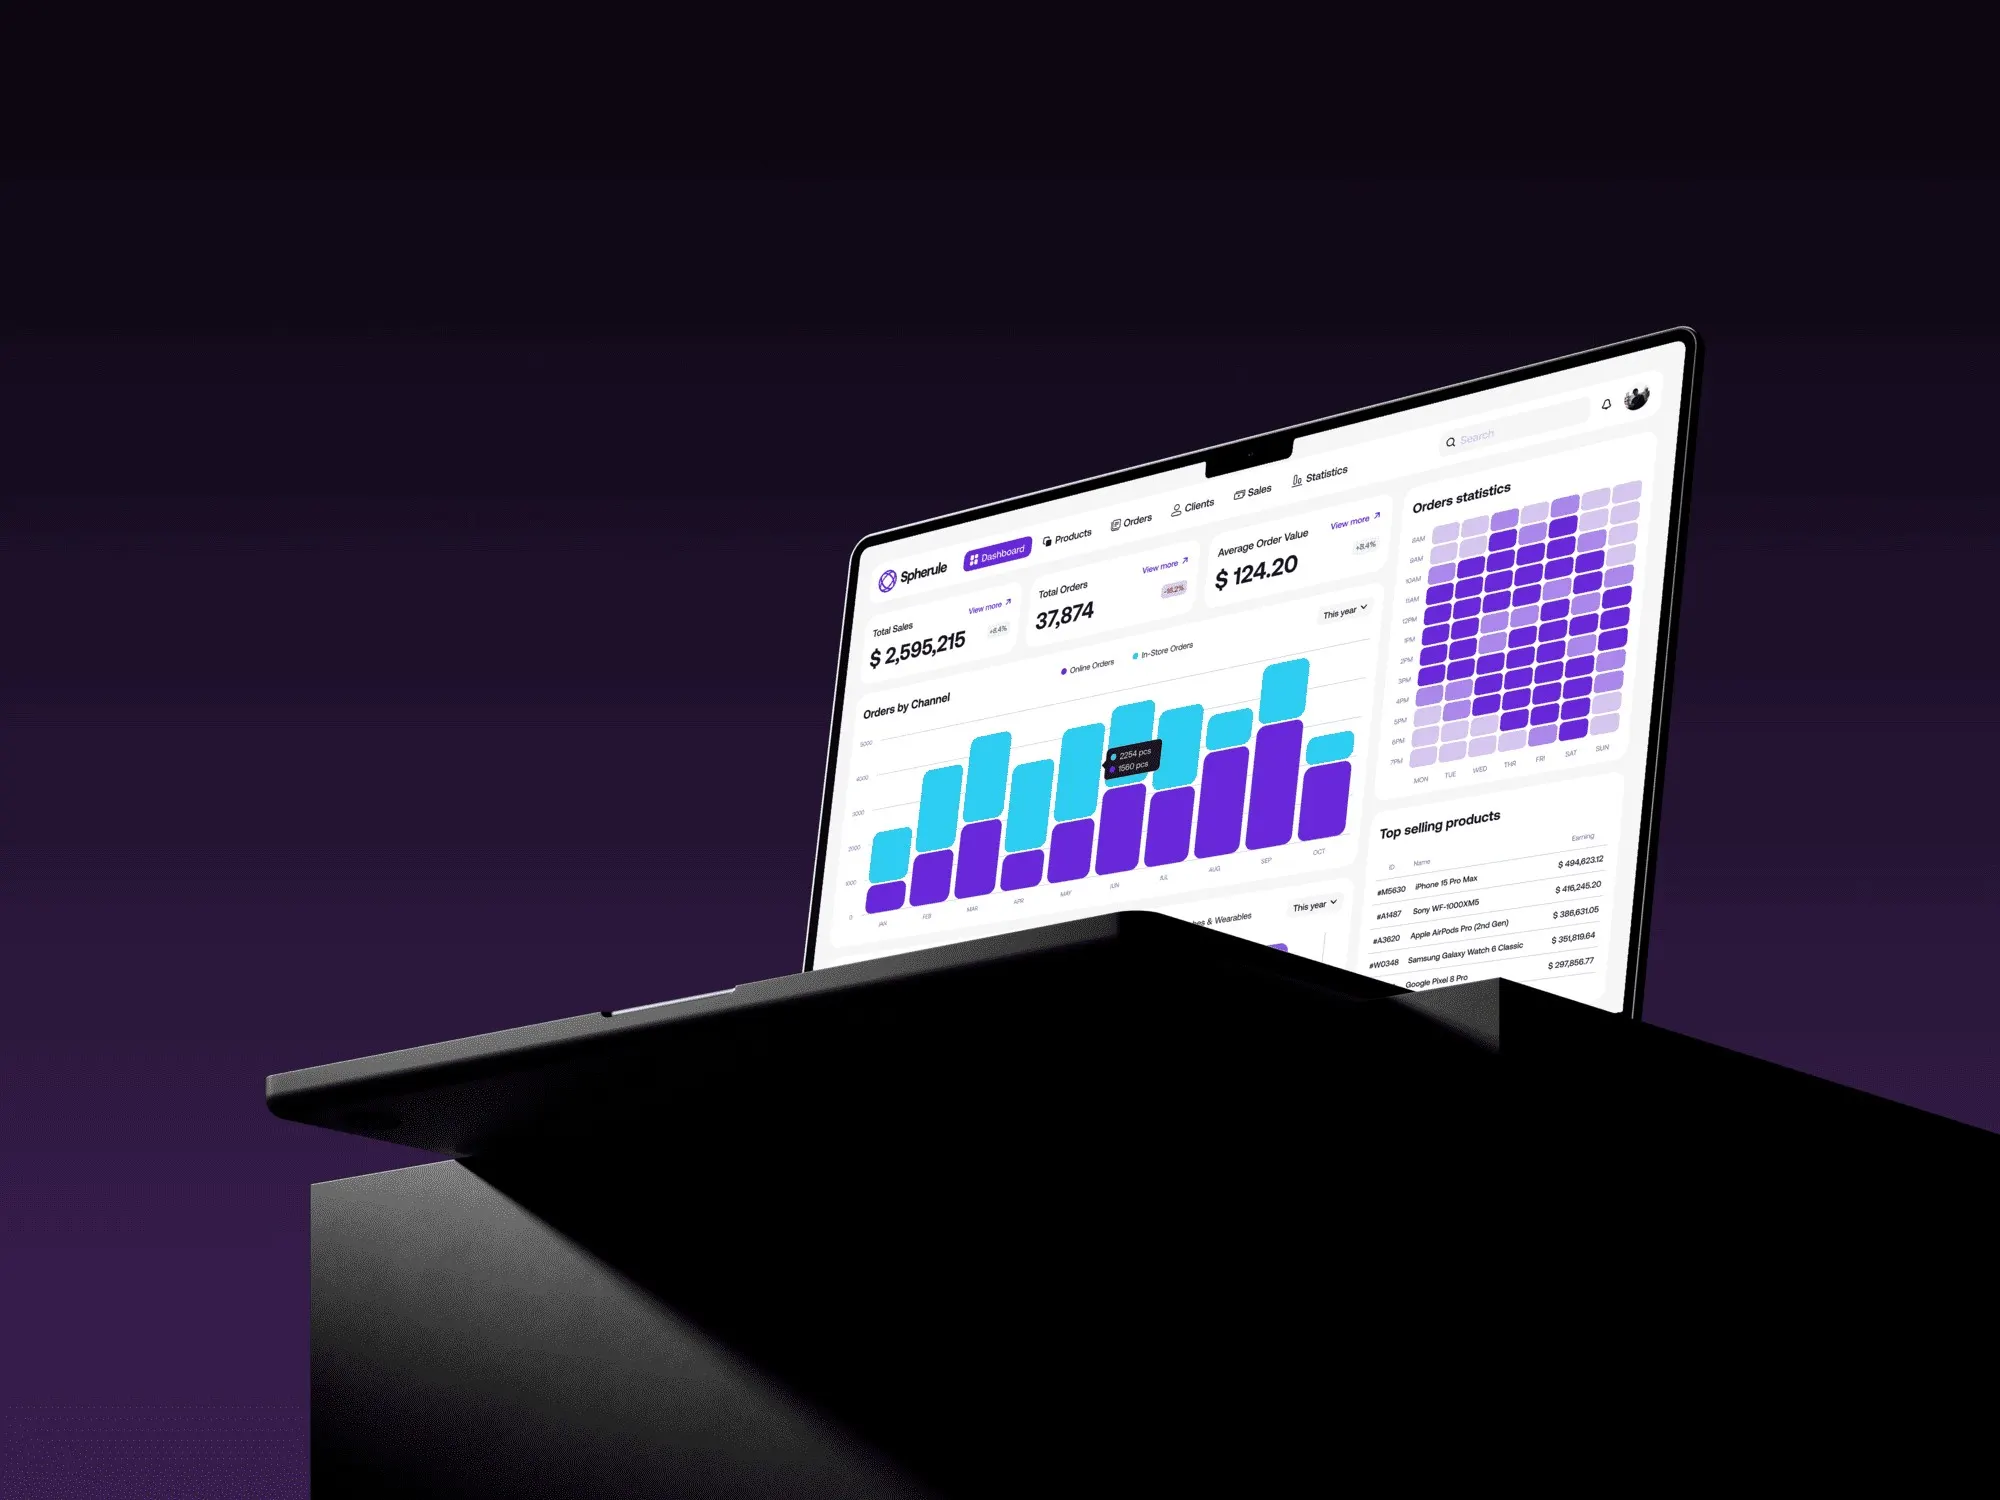
From noise to a single source of truth
E-commerce data usually lives in dense spreadsheets or cluttered panels. The goal was to cut through that noise: a single source of truth where key indicators and trends are visible right away.
02Information architecture
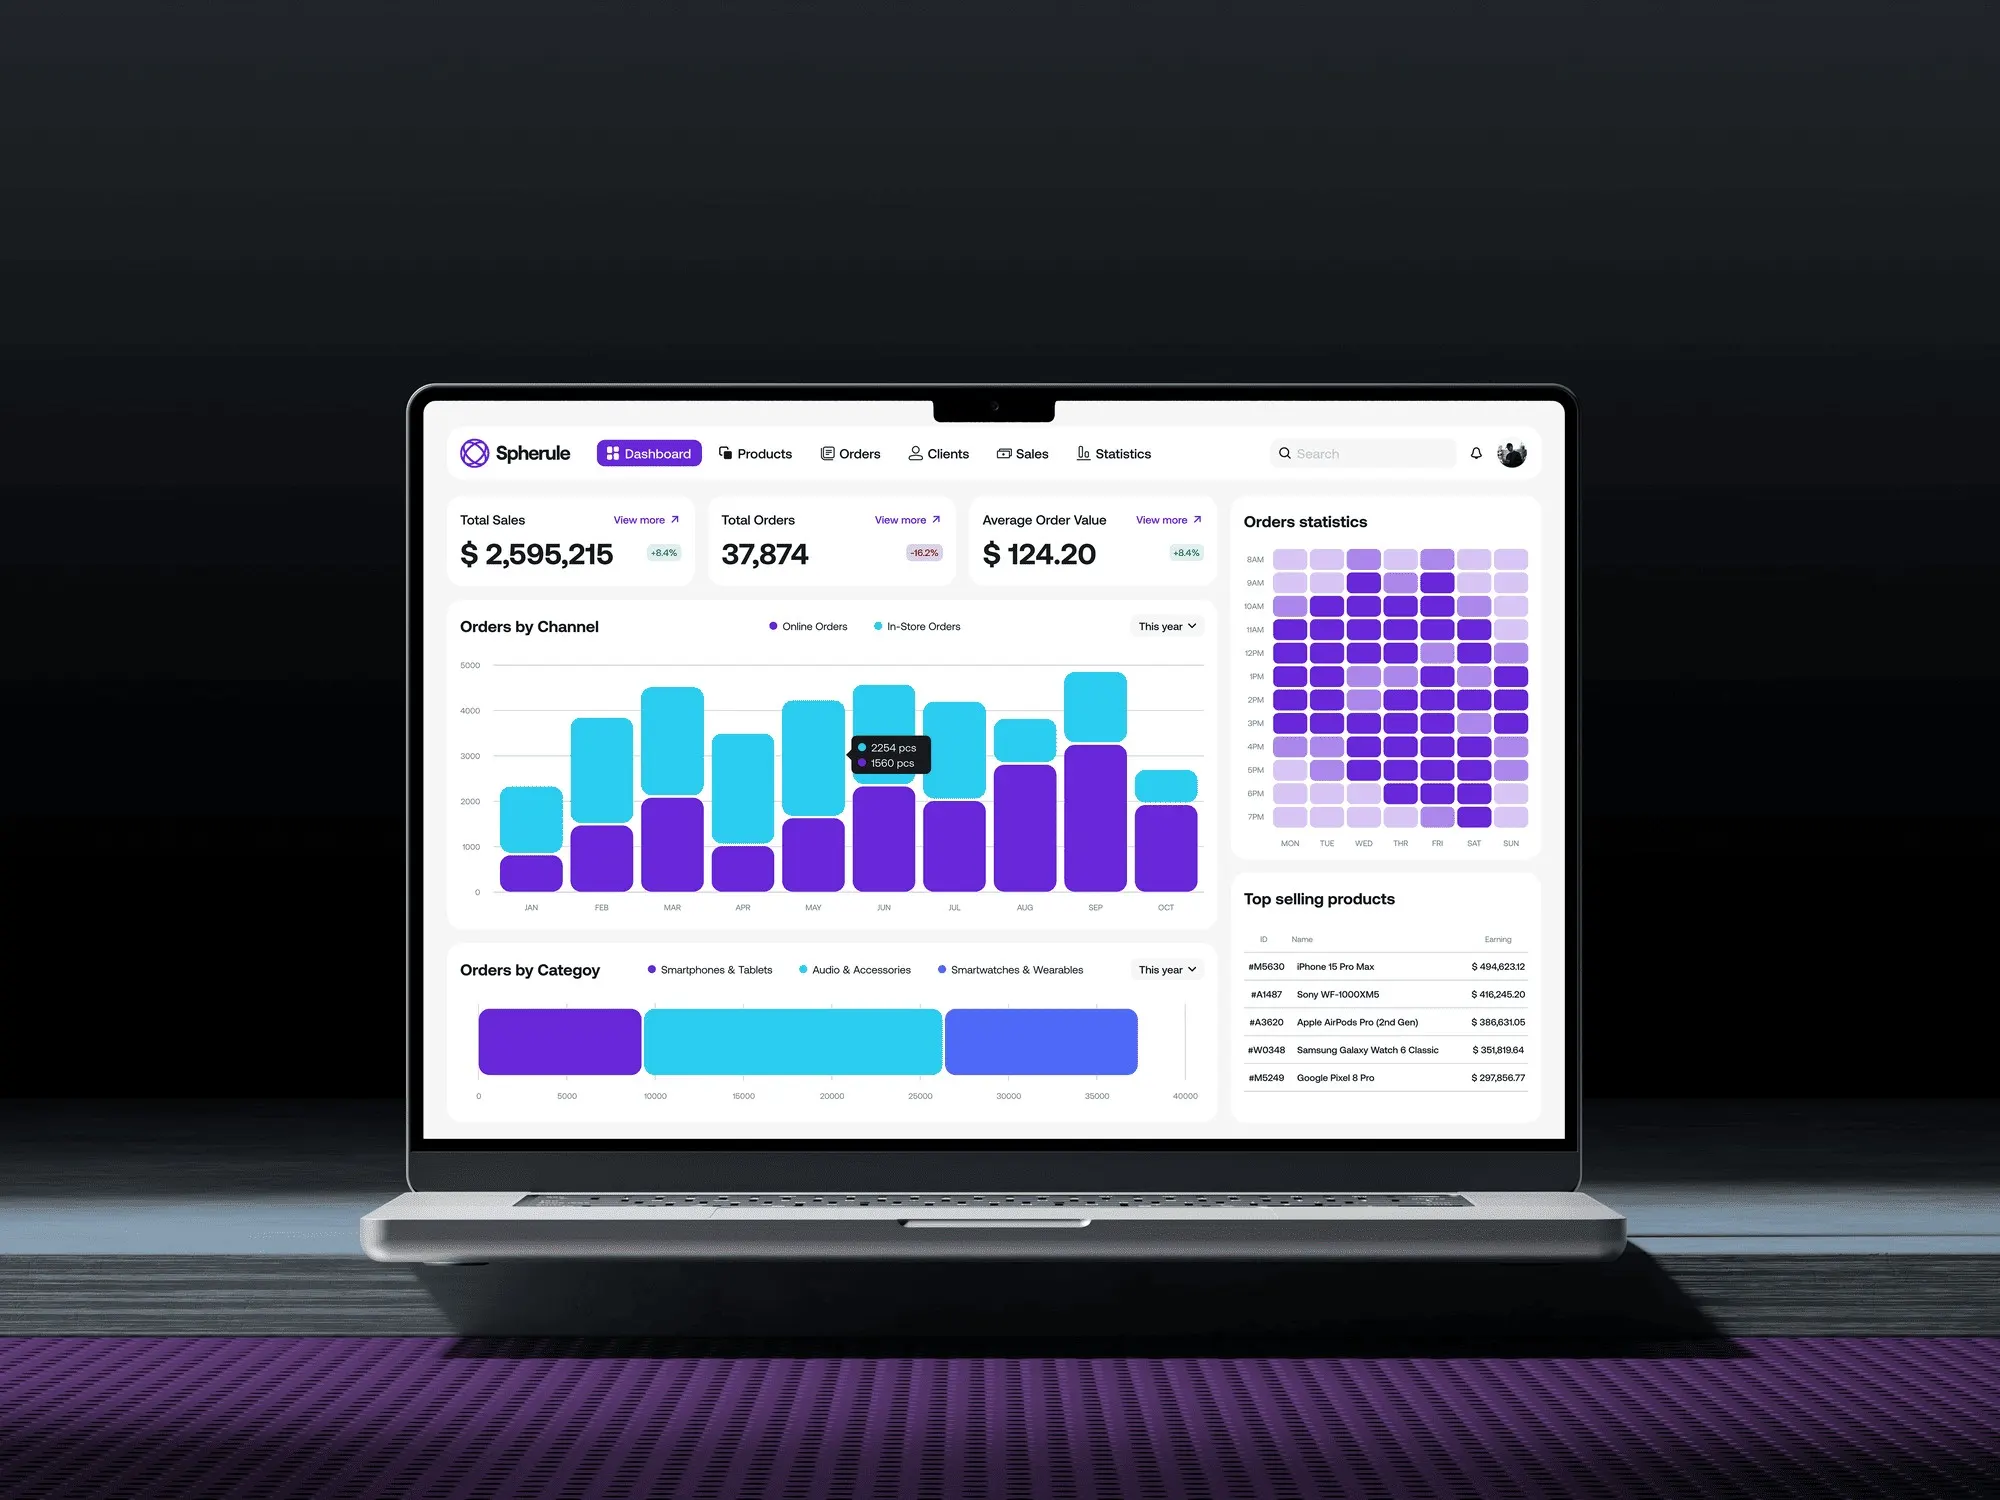
Overview first, detail second
I put what matters most at the top: total sales, orders and average order value. Below, the layout moves from general to specific: channel performance, categories, products and an order heatmap.
03Data visualization
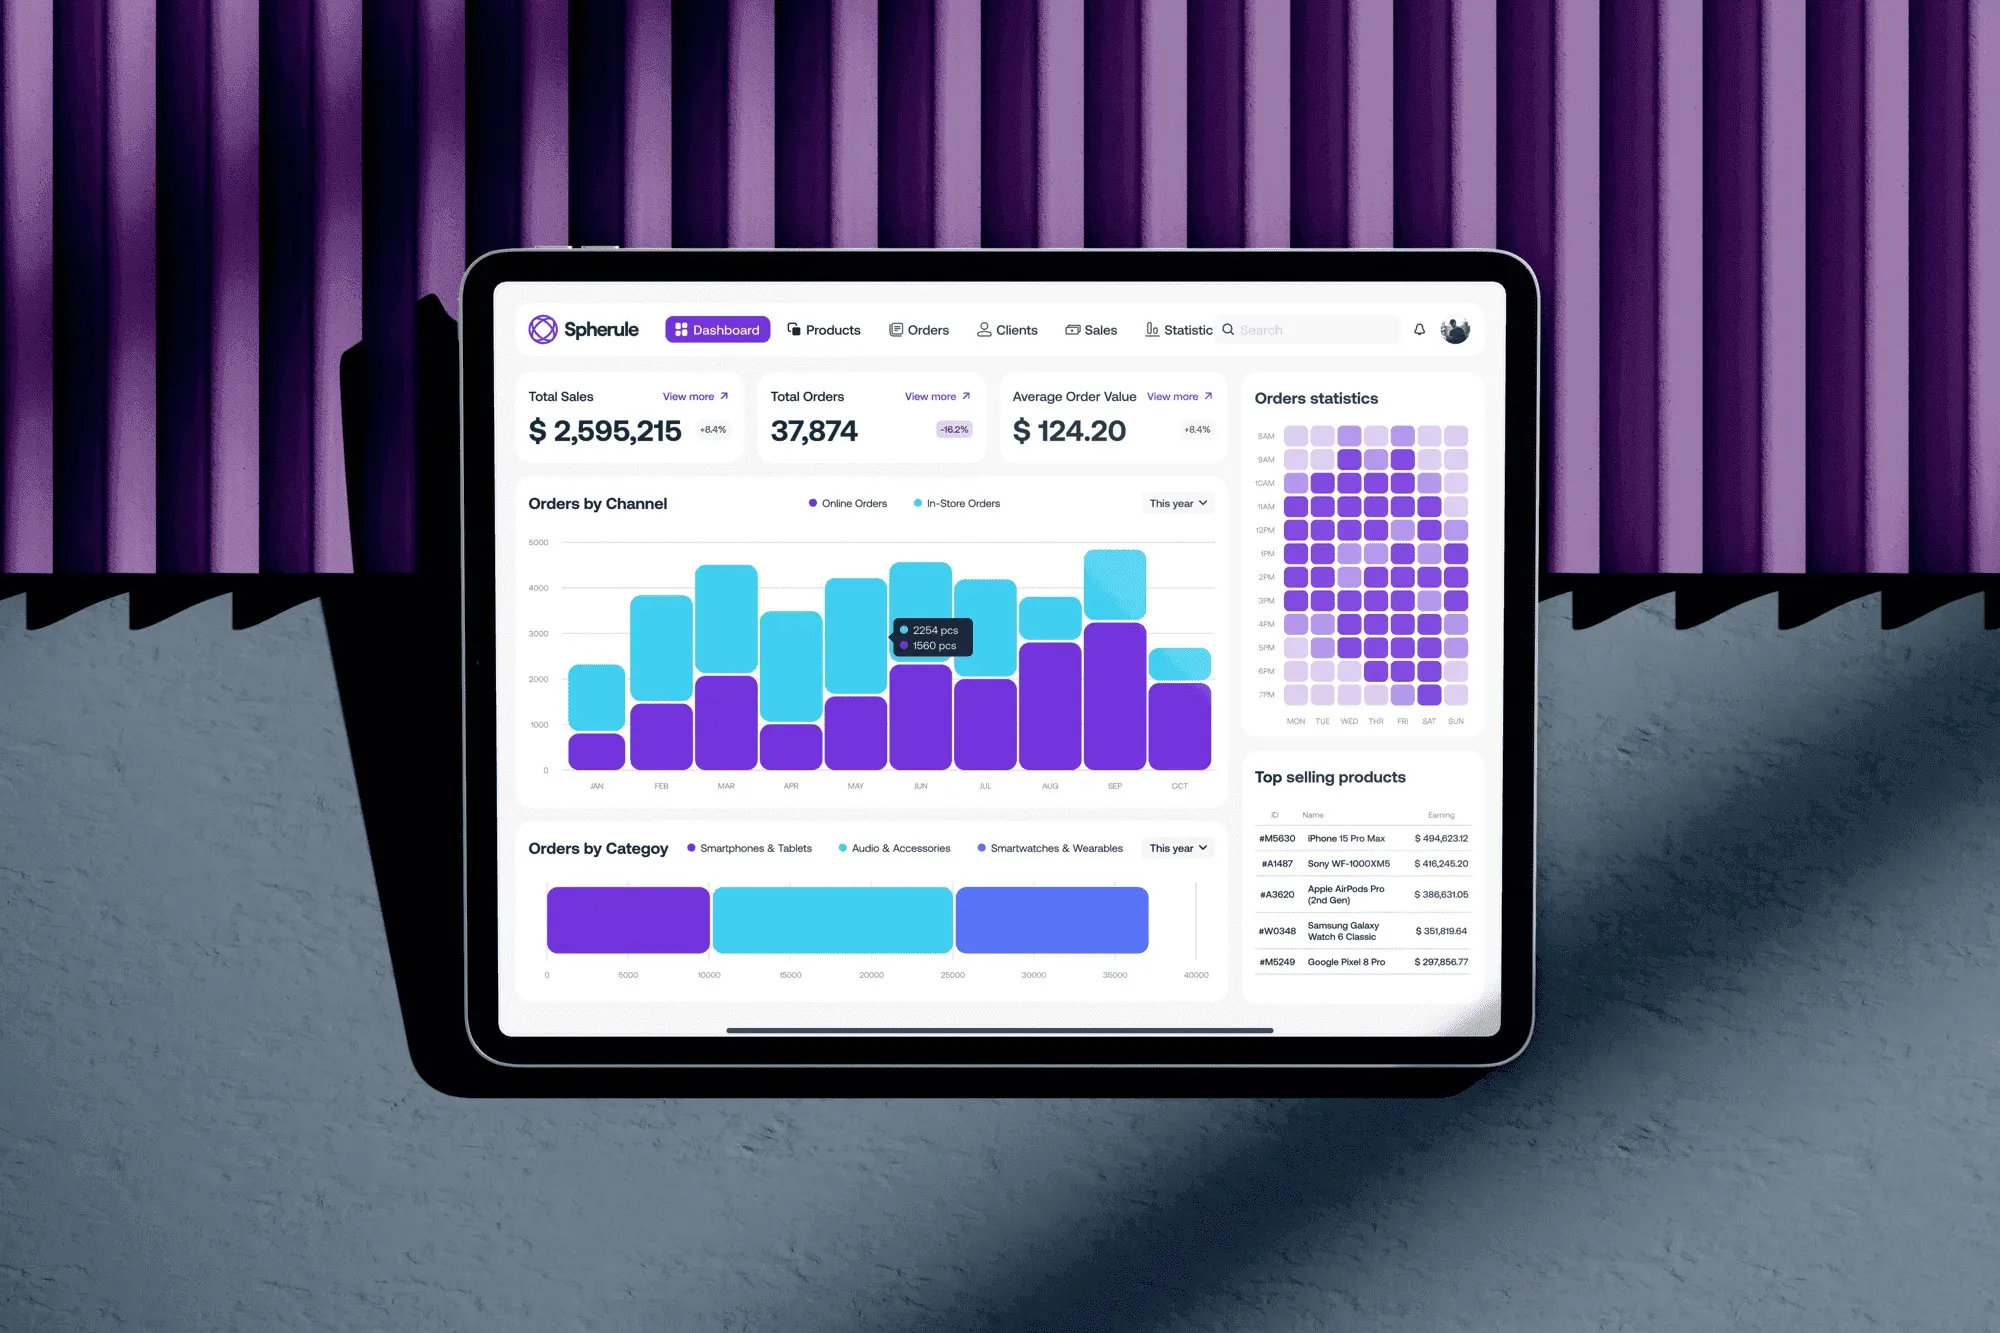
Each chart for what it says
I chose a light theme so the data leads. I picked each chart for what it communicates: bars for comparisons and a heatmap for order density over time. A minimal palette of blues and purples separates the series without adding noise.
04Result
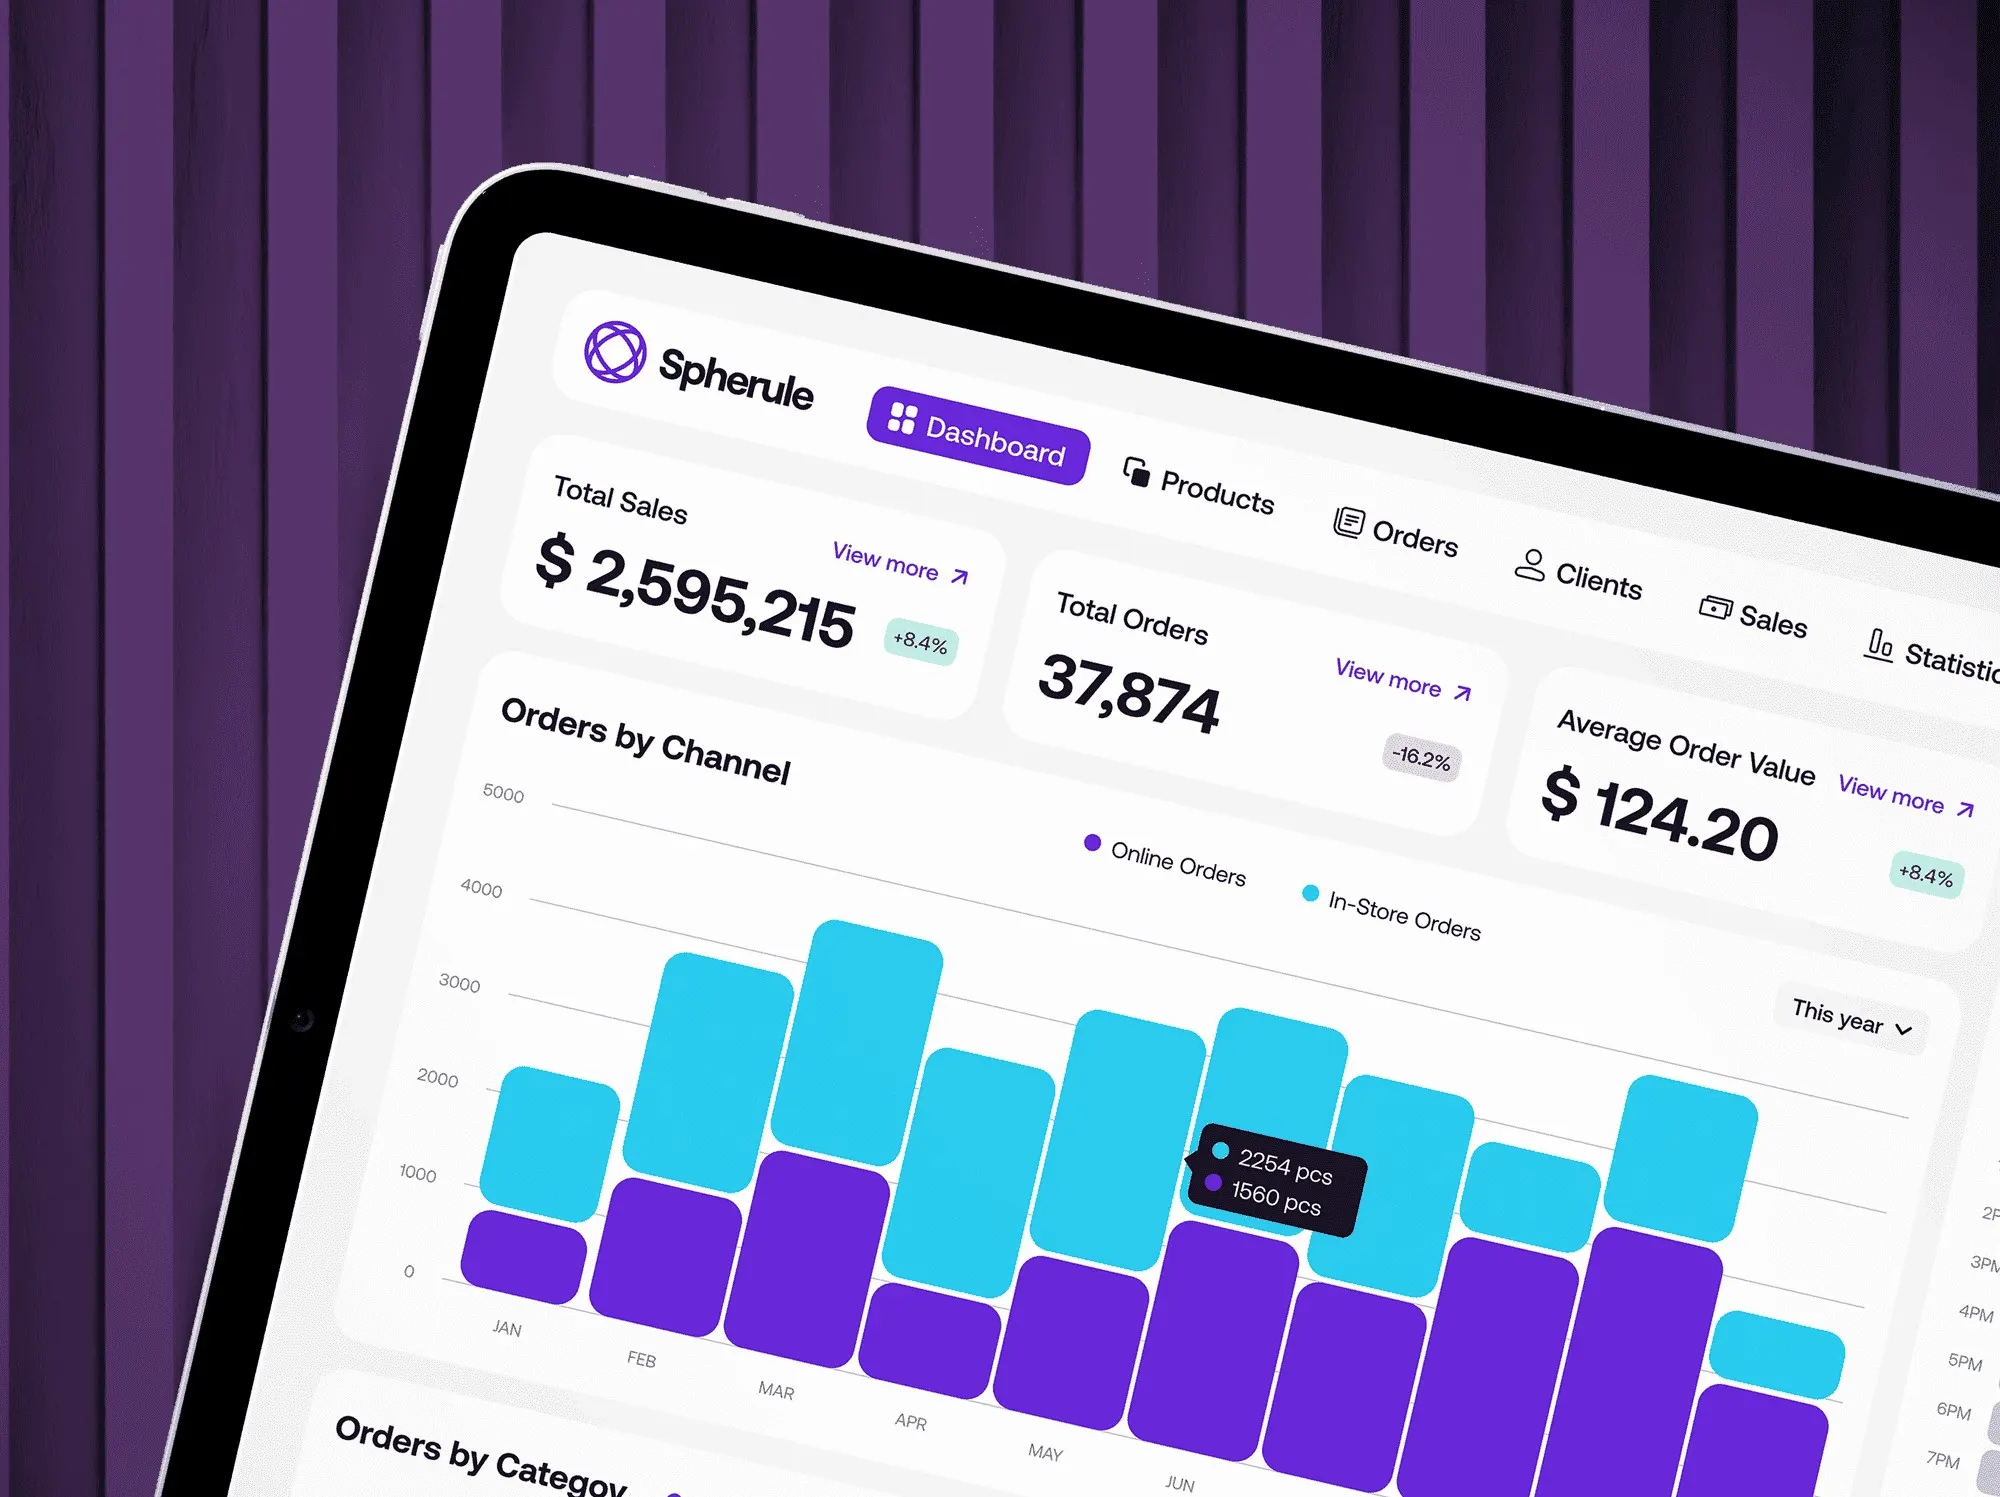
From report to daily tool
The dashboard stopped being a report and became part of the daily workflow. It’s the in-house app the e-commerce team uses to make data-informed decisions.
The closest matches to this case come first. Use the arrows to browse the rest.