UNDP Socioeconomic Map
A country’s indicators in one interactive map
brief.json
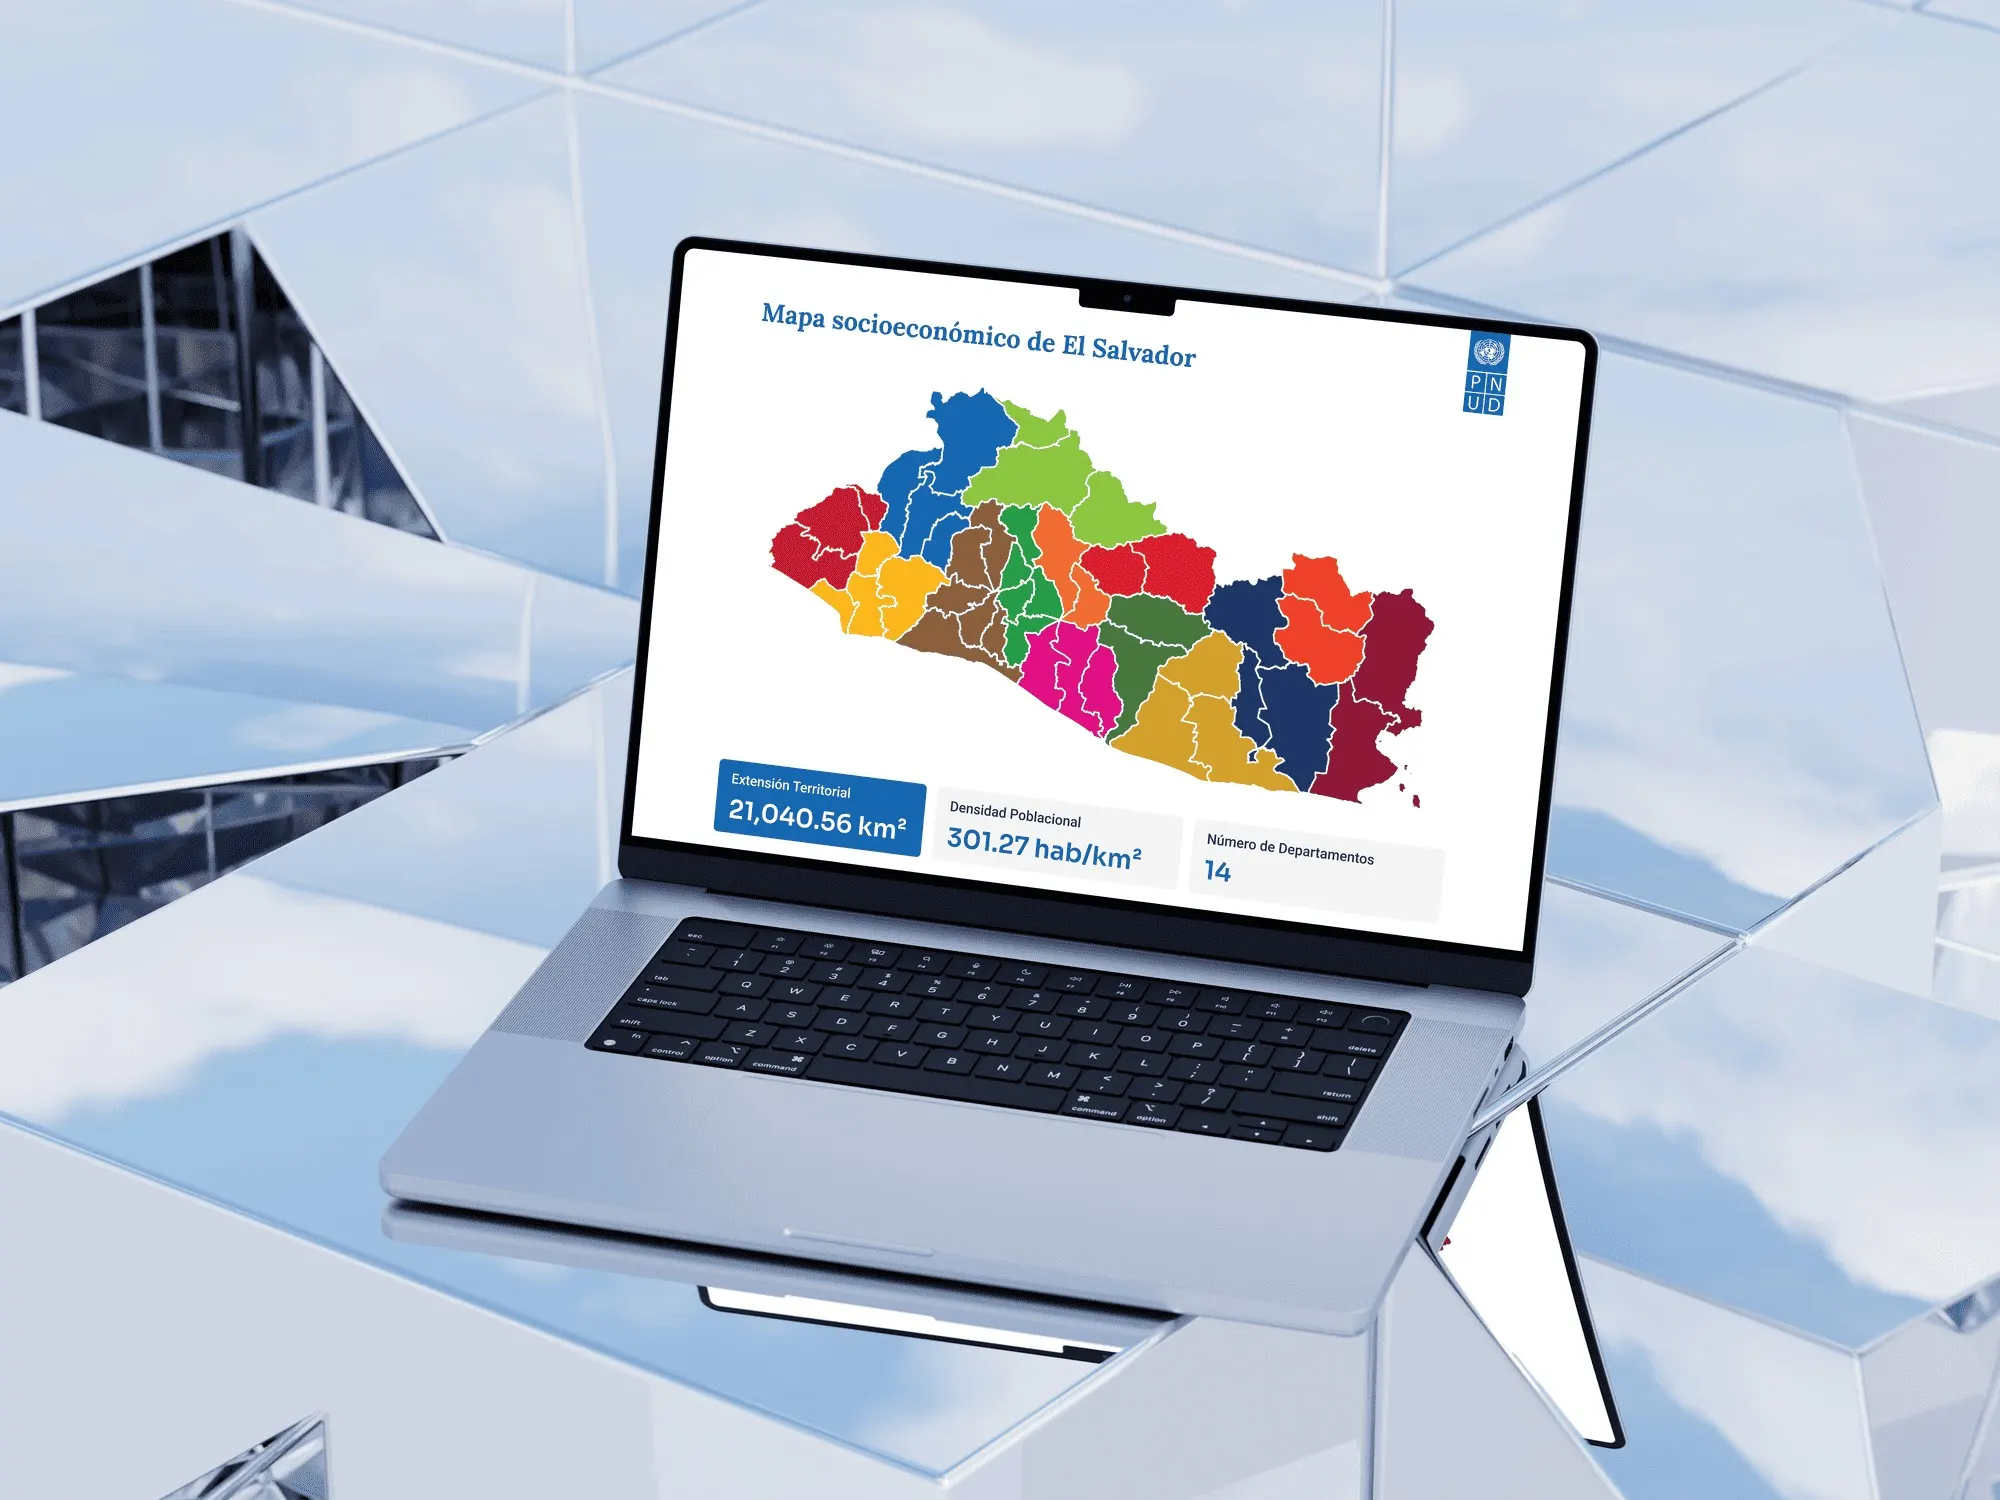
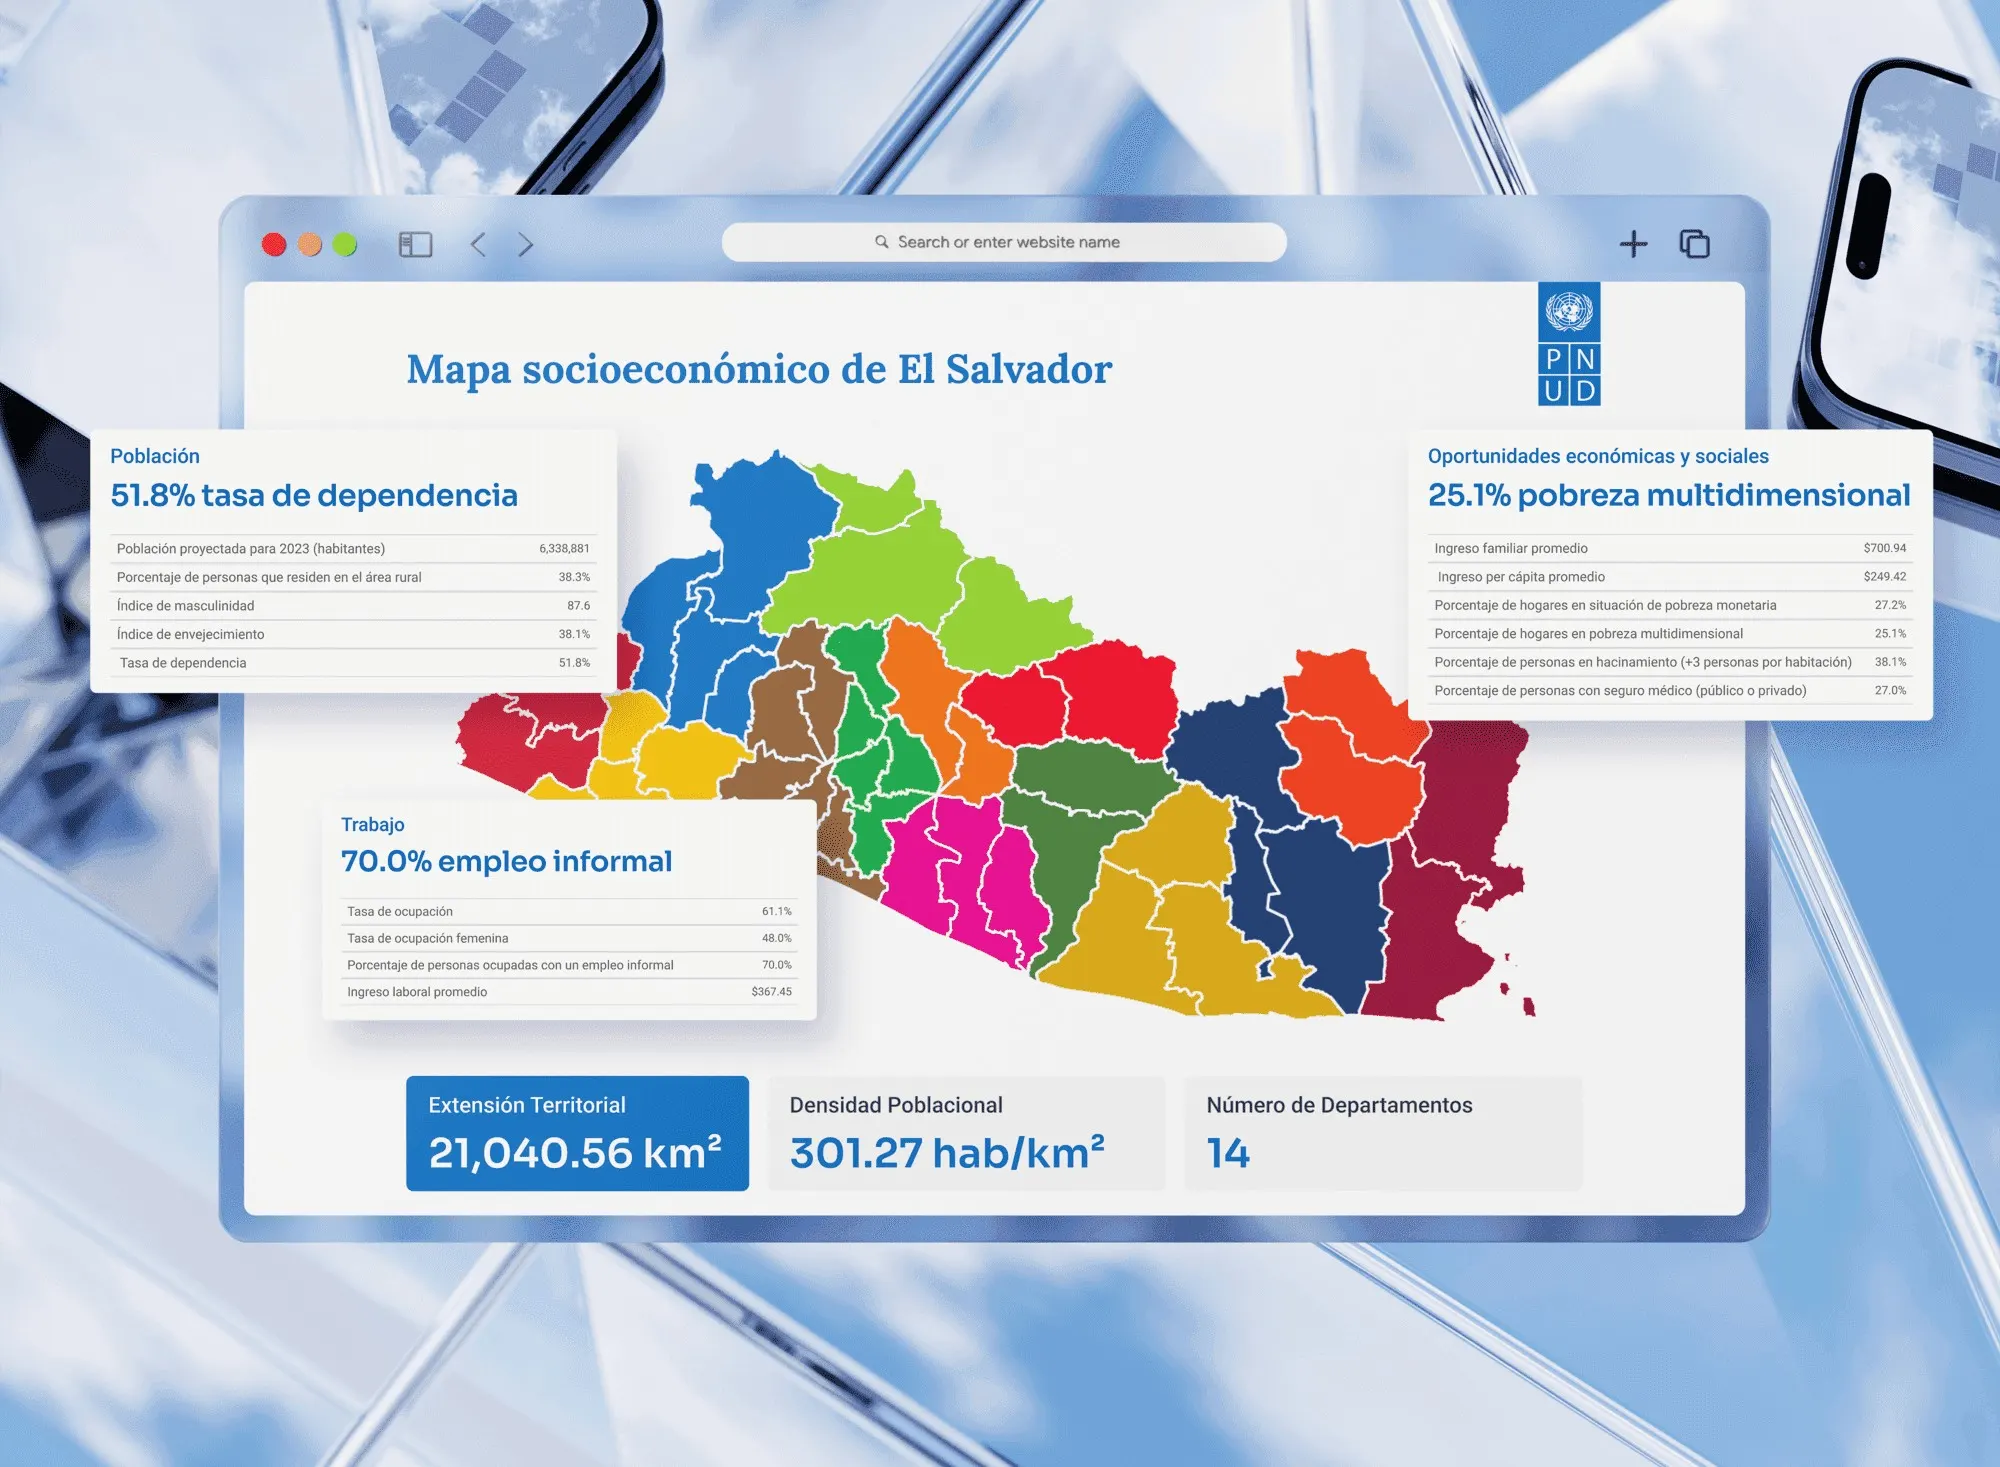
An interactive map summarizing El Salvador’s key socioeconomic indicators for UNDP. I proposed turning an extensive report into a map: click a municipality and see its data.
- Year
- 2024
- Client
- United Nations Development Programme (UNDP)
- Industry
- Data visualization
- Duration
- 3 weeks
- Type
- Interactive map
Web designData visualizationCustom solution
Shown for portfolio purposes only. Brands belong to their owners; if you own it and want it removed, email me. Terms ↗
01Challenge
Valuable data, too dense
UNDP had compiled an extensive report on El Salvador’s socioeconomic indicators. The data was valuable, but too dense for a broad audience. Hundreds of figures on poverty, education and public services had to reach policymakers and citizens alike.

02The solution
The map is the interface
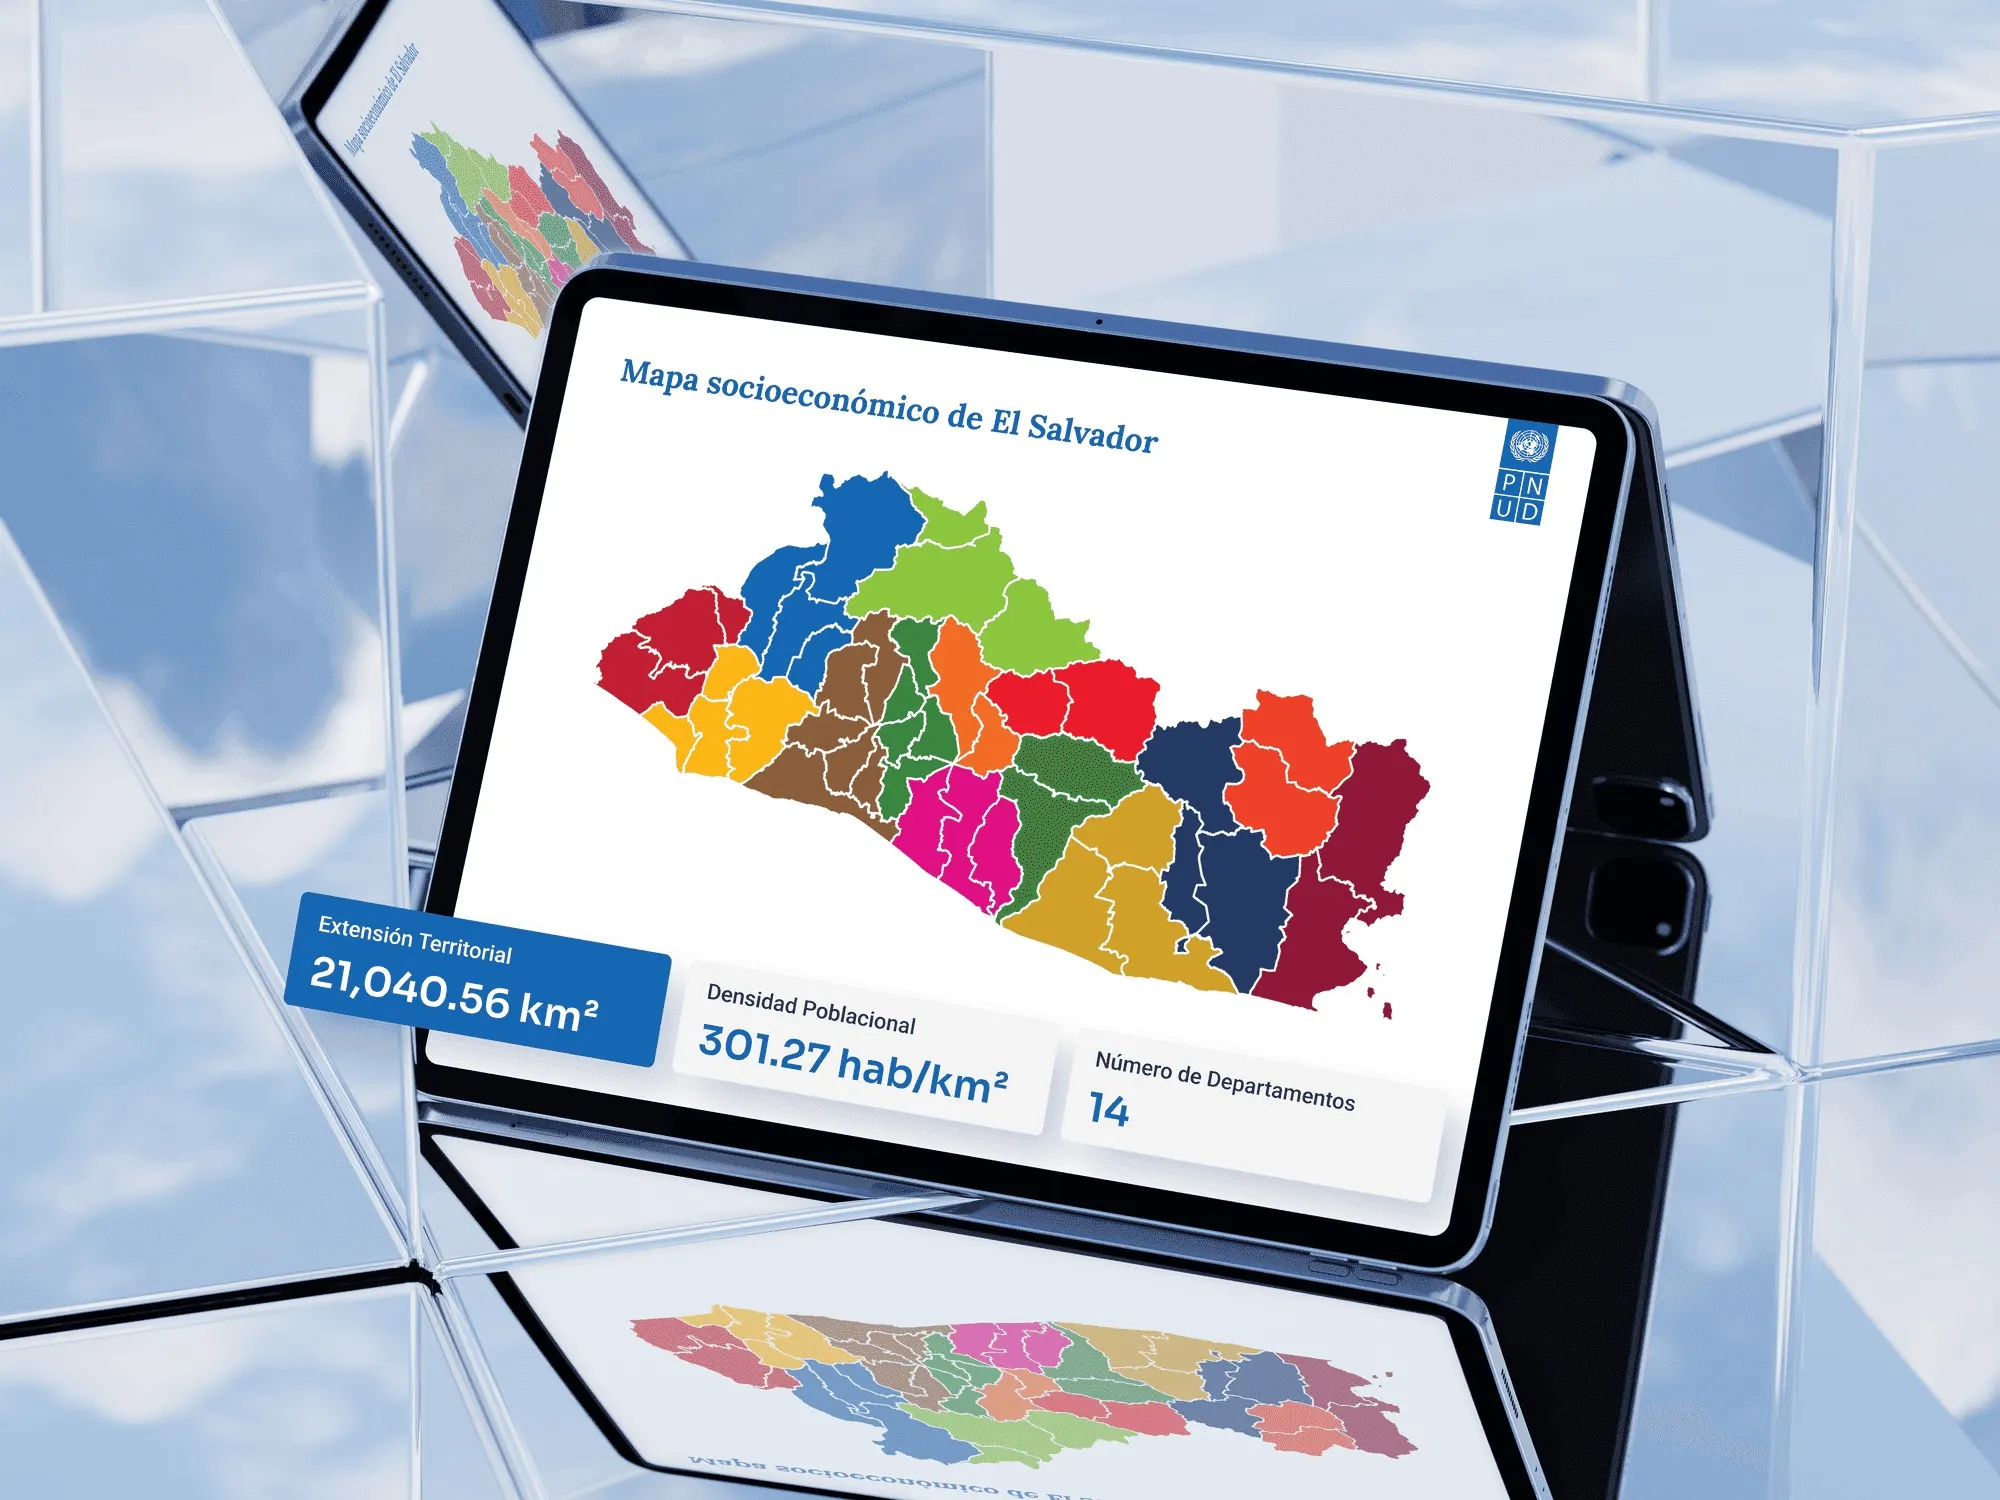
For geographic data, the most natural interface is a map. That’s why I proposed the map as the format. Instead of scanning tables, you click a municipality and see its indicators. A static report becomes a tool for exploration.
03Design & UX
Cards instead of tables
I kept the map front and center in a clean, minimal interface. Choosing a municipality opens a discreet panel with the indicators in easy-to-read cards. The numbers never become a wall.
04Result
From report to public tool
UNDP’s research went from a report to a public tool. Anyone can pick their municipality and look up its key data without scanning tables.
The closest matches to this case come first. Use the arrows to browse the rest.